 |

 |
| Advertisements |

|
|
 |
Ranking of Top 20 Translation Companies for 2006
By Renato Beninatto and Donald A. DePalma,
Common Sense Advisory, Inc.,
Lowell, MA, USA
info[at]commonsenseadvisory.com
http://www.commonsenseadvisory.com/
Become a member of TranslationDirectory.com at just
$12 per month (paid per year)
See also: Ranking
of Top 20 Translation Companies for 2004
See also: Ranking
of Top 20 Translation Companies for 2005
 
| |
Topic |
|
| |
First, let’s look at the numbers
– and then at what they mean to the business and practice of language-related
activities.
| Rank |
Company |
HQ
Country |
Revenue
in US$M |
Employees |
Offices |
Status |
1 |
L-3 Communications1
|
US |
622.0
|
8,496 |
50 |
Public |
2 |
Lionbridge Technologies |
US |
419.0
|
4,200 |
48 |
Public |
3 |
SDL International |
UK |
174.5
|
1,500 |
50 |
Public |
4 |
Language Line Holdings |
US |
163.3
|
n/a |
12 |
Private |
5 |
TransPerfect/Translations |
US |
112.8
|
647 |
46 |
Private |
6 |
SDI Media Group |
US |
95.0
|
500 |
25 |
Private |
7 |
RWS Group2 |
UK |
73.4
|
346 |
8 |
Public |
8 |
Xerox Global Services3 |
UK |
68.0
|
350 |
7 |
Public |
9 |
euroscript International S.A. |
LU |
62.8
|
755 |
16 |
Private |
10 |
Moravia Worldwide |
CZ |
43.5
|
502 |
12 |
Private |
11 |
Logos Group |
IT |
43.3
|
169 |
13 |
Private |
12 |
CLS Communication |
CH |
40.7
|
280 |
13 |
Private |
13 |
Honyaku Centre4 |
JP |
32.6
|
128 |
5 |
Public |
14 |
LCJ EEIG |
DE/ IT/ BE/ ES |
32.1
|
214 |
12 |
Private |
15 |
Semantix |
SE |
31.2
|
140 |
6 |
Private |
16 |
Merrill Brink International5 |
US |
29.8
|
150 |
4 |
Private |
17 |
Welocalize, Inc. |
US |
28.2
|
254 |
7 |
Private |
18 |
Skrivanek Group |
CZ |
23.6
|
370 |
51 |
Private |
19 |
Hewlett-Packard ACG |
FR |
22.0
|
90 |
8 |
Private |
20 |
thebigword Group |
UK |
21.0
|
155 |
8 |
Private |
Table
1: Top 20 Language Service Providers Worldwide for Calendar 2006
Source: Cited Companies and Common Sense Advisory, Inc. |
1
L-3 language revenue comes from its Linguist Operations & Technical
Support Division.
2
RWS’s fiscal year ended on September 30, 2006.
3
Xerox does not disclose the revenues of its divisions, so this is an
estimate.
4
Honyaku’s fiscal year ends March 31, 2007. The revenue data corresponds
to the sum of quarterly results from the third calendar quarter of 2005
to the third quarter of 2006.
5
This is an estimate as its parent, Merrill Corporation, seems to
be planning to go public.
|
| |
| |
Methodology for Picking the Top 20 |
| |
Since 2005 we have published an annual list of
the largest language service providers (LSP). The guiding principle
for which LSPs we consider for this year’s Top 20 is simple
– companies or divisions of companies that make most of their
revenue by providing language services, be it in written or verbal
form, on paper, over the web, in person, on video, inside software
applications, on any continent.
In the past we limited our consideration to LSPs
that derive most of their revenue from translation. This year we
decided to track providers by the type of work they do, so we asked
candidates about the percentage of their revenue that derives from
translation, software localization, and over-the-phone interpreting
(OPI).
We were surprised to learn that most companies do
not track revenue at that level of detail. Likewise, you can forget
about categories like internationalization, localization engineering,
desktop publishing, and project management. Therefore, we decided
to include companies practicing every form of “-ization”
related to language. We think this information would provide valuable
insight into the layers of revenue within the industry and how this
will change over time. However, the fact that most LSPs don’t
break out this detail reflects the level of industry business maturity
and service fragmentation. In the next year or two, we expect to
break out software revenue from companies like SDL as they reinvent
themselves into technology companies.
Finally, previous lists picked from just language
service firms doing business in North America and Europe. In the
last few months we’ve expanded our research of companies in
Asia, so our candidates included several LSPs in China and Japan.
One Japanese company made the final cut. Looking forward, we expect
to find companies in east and south Asia making the shortlist in
future years. |
| |
Top 20 Companies Jockey for Position in the Last Year |
| |
Who will you buy language services from in 2010?
Your shortlist will likely be a different one than what you might
pick today. Consider the history: The five largest LSPs in 2000
were Berlitz, Bowne Global, Lernout & Hauspie (L&H), Lionbridge,
and Alpnet. In 2006 they were Lionbridge, L-3, SDL, TransPerfect,
and RWS. Bowne absorbed some of L&H, Lionbridge swallowed some
bits of L&H on its own and then Bowne in its entirety. SDL acquired
Alpnet.
Who's at the top of the heap in 2007? L-3 leapt
into first place based on its work for the U.S. Army in Iraq. Lionbridge
consolidated revenue from its acquisition of Bowne, reaching US$419M.
SDL grew to US$174.5M, and TransPerfect vaulted to US$112.8M. Looking
forward to next year, we expect more changes due to market consolidation,
growth in rapidly developing countries, the economic pressures of
outsourcing, business reversals, and contract losses. Other companies
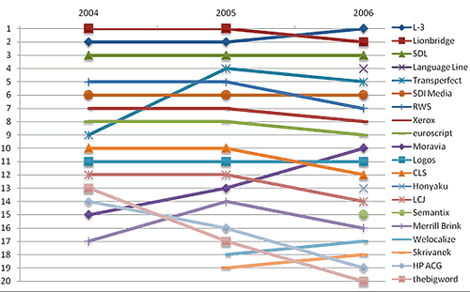
have moved up and down the list since we started keeping track in
2004 (see
Figure 1). Looking ahead we see several major changes
in the offing for next year’s lineup:
- The U.S. Army voted L-3 off the Top 20.
In late December 2006 the U.S. Army awarded DynCorp International
and McNeil Technologies a five-year contract worth up to US$4.6
billion to provide linguists to the U.S. military in Iraq. L-3
(number 1) was the Army’s incumbent provider. The company
could drop out of the Top 20 altogether if it loses its protest,
while McNeil – on last year’s list, off this year
– could be at the top of the heap next year. L-3 violated
a cardinal rule of business by putting all of its wars in one
basket.
- The race to number four continues.
Every other firm wants to be number four on our list.6
Merger and acquisition activity continues. For example, Euroscript
revealed in May 2007 that it would merge with eurodoc to create
an €85 million provider. In March 2007, Welocalize (number
17) announced its intention to be number three within three years.
Of course, the Welocalize plan hinges on the unlikely scenario
that all other participants in this market will stand still, neither
growing organically nor acquiring anyone.
- SDL will try for a different list.
With its April 2007 announcement that it would buy CMS supplier
Tridion, SDL signaled its intention to move up the food chain.
Equity markets value software firms higher than service providers,
so SDL will aim to push its software income to be an increasing
percentage of revenue. Sooner or later, SDL may follow our longstanding
recommendation to split its technology and language services into
separate businesses.
- Private equity lurks at the threshold.
In our predictions for 2007 we speculated about private equity
buy-outs of the largest firms in the space. This thought echoed
our 2004 musing about Indian business processing outsourcing (BPO)
firms leveraging their huge capitalizations to buy out even Lionbridge.
Just do the math: Infosys and Wipro have market caps of US$31
billion and $24 billion, respectively. Both are very profitable
(27% and 19%). In comparison, Lionbridge has a market value of
less than its annual revenue ($337.8 million) and a negative profit
margin. In today’s atmosphere of large corporations being
taken private, this sector could be the next target for outside
money.
 |
Figure 1: Movements in the
Ranking of the Top 20 from 2004 to 2006
Source: Common Sense Advisory, Inc. |
In the final analysis, most of these companies are
still tiny enterprises subject to the vagaries of the marketplace.
They are all small enough – Lionbridge not excepted –
to be rolled up by publicly traded firms and private equity deals.
Finally, as L-3’s experience shows, the loss of a big client
can change the situation overnight.
6
Some LSPs discount the inclusion of a supplier of military language
services, so they disingenuously say they want to be number
three. However, the most vocal of the “L-3 doesn’t
count” camp could bid on that same defense and intelligence
business since they are U.S. corporations themselves.
|
| |
Sector Growth Outpaced the General Market |
| |
The language service providers in our Top 20 averaged
24.5 percent growth over the previous year. Some grew by acquisition,
others organically, and some others by virtue of foreign exchange.
Five LSPs dramatically exceeded the average, with the top two –
Moravia and L-3 – growing organically (see
Table 2). Logos heads the list in revenue per employee
(see Table
4).
| Company |
Revenue Growth
from 2005 to 2006 |
Moravia Worldwide |
72.6% |
L-3 Communications |
67.1% |
TransPerfect/Translations |
52.4% |
SDI Media Group |
46.2% |
Welocalize, Inc. |
37.5% |
Average of Top 20 |
24.5% |
Table 2: Five
Fastest Growing Companies for 2006
Source: Common Sense Advisory, Inc. |
| Company |
Number
of
Employees |
L-3 Communications |
8,496 |
Lionbridge Technologies |
4,200 |
SDL International |
1,500 |
euroscript International |
755 |
TransPerfect/Translations |
647 |
Table
3: Top Five LSPs by Number of Employees
Source: Common Sense Advisory, Inc. |
| Company |
Revenue
per Employee
in USD |
Logos Group |
$256,447.28
|
Honyaku Centre |
$254,459.38
|
Hewlett-Packard ACG |
$244,444.44
|
Semantix |
$223,198.57
|
RWS Group |
$212,260.59
|
Table
4: Top Five LSPs by Revenue per Employee
Source: Common Sense Advisory, Inc. |
 |
Figure 2: Top 20 Aggregate
Revenue and Growth Rate from 2004 to 2006
Source: Common Sense Advisory, Inc. |
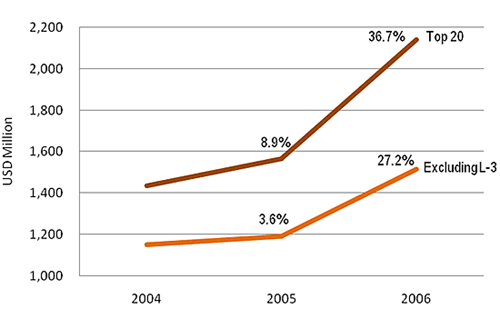
The total revenue accounted for by the Top 20 language
service providers has grown steadily since 2004 (see
Figure 2). From 2004 to 2005 these leading LSPs grew
slightly faster than our estimate of 7.5 percent (see “Ranking
of Top 20 Translation Companies,”
Mar06). However, they leapt 36.7 percent from 2005 to 2006 –
fully 4.8 times the sector growth rate. We attribute some of that
increase to revenue consolidation and the big jump in language-related
activities for Iraq, Afghanistan, Guantanamo, and other defense
and intelligence needs. |
| |
Language Services Market Will Continue Growing |
| |
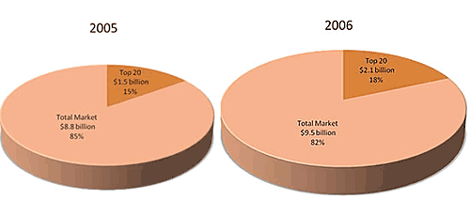
Last year Common Sense Advisory estimated that
the market for outsourced language services would hit US$9.5 billion
in 2006 and grow to over US$10 billion this year (see
Table 5). Our estimate was predicated on a growth rate
of 7.5 percent, line with the World Trade Organization’s estimate
for general commercial services.
| Region |
% of Total Market |
2007 |
2008 |
2009 |
2010 |
2011 |
U.S. |
42% |
4,271 |
4,592 |
4,936 |
5,306 |
5,704 |
Europe |
41% |
4,169 |
4,482 |
4,818 |
5,180 |
5,569 |
Asia |
12% |
1,220 |
1,312 |
1,410 |
1,516 |
1,630 |
ROW |
5% |
508 |
547 |
588 |
632 |
679 |
Totals |
N/A |
10,168 |
10,933 |
11,752 |
12,634 |
13,582 |
Table 5: Language
Services Revenues, in U.S. Millions of Dollars
Source: Common Sense Advisory, Inc. |
 |
Figure 3: Top 20 Aggregate
Revenue and Growth Rate from 2004 to 2006
Source: Common Sense Advisory, Inc. |
Across the market we see demand growing at 15 to
20 percent per year, driven by national regulations, website and
product localization (see “Developing
Products for Global Markets,” Jun06), and consumer
need for more information in their own language (see “Can’t
Read, Won’t Buy,” Aug06). But at the same
time, we see industry growth holding steady at below 10 percent.
Why this discrepancy? In this highly competitive
market, most productivity gains benefit the customer, not the LSP.
We do not find price erosion in core metrics like price per new
word, but we do see the impact of translation automation and reduced
publishing costs from XML conversion. LSPs are literally doing more
for less but for less effort. The 15-20 percent growth in overall
demand translates into a blended 7.5 percent increase in revenue.
What does the future hold? We have highlighted opportunities
for LSPs to get involved in a potential US$50 billion market of
the global content life cycle (see “Beyond
Global Websites,” Mar05). By helping clients improve
source content and quality, they could build up revenue while they
improve their standing in the value chain (see “Beggars
at the Globalization Banquet,” Nov02). |
|
Ranking of Top 20 Translation Companies |
by Renato Beninatto
and Donald A. DePalma
May 2007
ISBN: pending
Copyright © 2007 by Common Sense Advisory, Inc. Lowell, Massachusetts,
United States of America.
Published by:
Common Sense Advisory, Inc.
100 Merrimack Street
Suite 301
Lowell, MA 01852-1708 USA
+1.866.510.6101 or +1.978.275.0500
info@commonsenseadvisory.com
www.commonsenseadvisory.com
No part of this publication may be reproduced, stored
in a retrieval system or transmitted in any form or by any means, electronic,
mechanical, photocopying, recording, scanning or otherwise, except as
permitted under Section 107 or 108 of the 1976 United States Copyright
Act, without the prior written permission of the Publisher.
Permission requests should be addressed to the Permissions Department,
Common Sense Advisory, Inc., 100 Merrimack Street, Suite 301, Lowell,
MA 01852-1708, +1.978.275.0500, E-Mail: info@commonsenseadvisory.com.
See www.commonsenseadvisory.com/others/citation_policy.php
for usage guidelines.
Trademarks: Common Sense Advisory, Global DataSet, DataPoint,
Globa Vista, Quick Take, and Technical Take are trademarks of Common Sense
Advisory, Inc. All other trademarks are the property of their respective
owners.
Information is based on the best available resources at the time of analysis.
Opinions reflect the best judgment of Common Sense Advisory’s analysts
at the time, and are subject to change. |
Submit your article!
Read more articles - free!
Read sense of life articles!
E-mail
this article to your colleague!
Need
more translation jobs? Click here!
Translation
agencies are welcome to register here - Free!
Freelance
translators are welcome to register here - Free!
|
 |
 |
| Free
Newsletter |
 |
|
|
|
 |


